Can You Paint by Number?
This Week's Fiddler
When we start a new cluster, we have one square guaranteed, and then there's a 50% chance the next square will continue the cluster. We want to find the average size of said cluster.
It's a geometric distribution with a probability of failure! In essence, the cluster continues to grow so long as there is "success". While the failure itself does not contribute to the count, we start counting at 1, evening out the ends of any off-by-one offset. Thus, the expected value is .
Interestingly, we can also reason about this another way. We know that the chance of a cluster being size 1 is , the chance of it being size 2 is , the chance of it being size 3 is , etc. Thus, the expected cluster size is . This is a known identity (using calculus) which evaluates to 2, confirming our answer.
Answer: 2 squares
Extra Credit
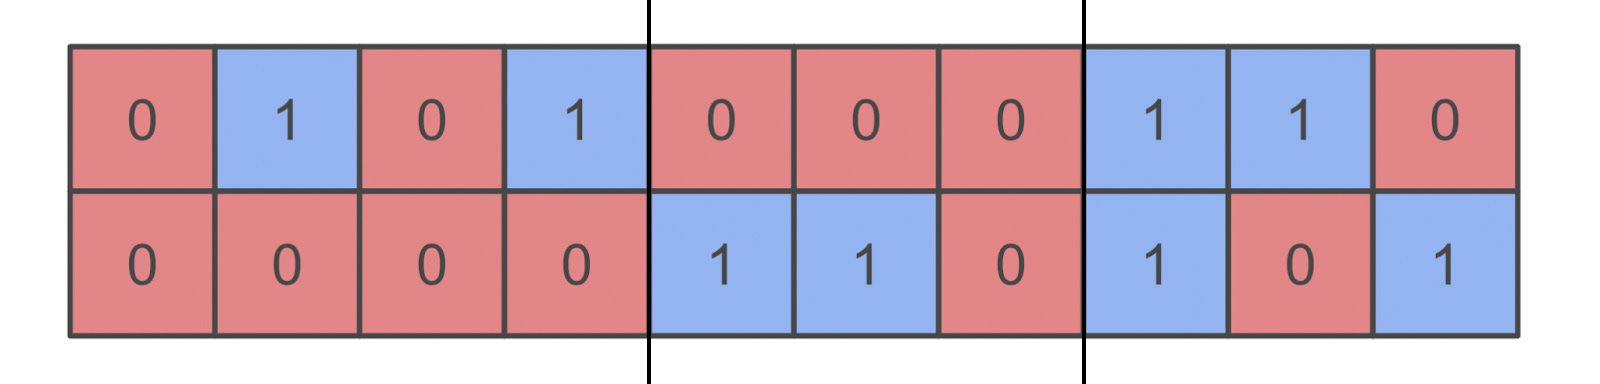
Let's consider a rectangular "chunk": the resulting rectangle obtained when drawing two vertical lines in the strip such that the lines do not go through any cluster. Specifically, let's consider the minimum such chunk, that is, the rectangular chunks that contain no smaller rectangular chunks within them. For example, if the example in the problem were to be chunked, it would look like this:
How many squares per chunk?
Note that chunks stop if and only if each row, going from one column to the next, flips color. Since there are 2 rows and 2 colors, the chance of this happening on each column border is , meaning we expect the average chunk to contain 4 columns. As there are 2 rows per column, this makes for 8 squares per chunk.
However, that's not what we want to find out; we want to find out the average number of squares per cluster. Luckily, while chunks can contain multiple clusters, we have constructed them in such a way that they cleanly divide up clusters; that is, we can count how many clusters we expect per chunk.
How many clusters per chunk?
For each column, let's define two possibilities: (the two squares have the same color) and (the two squares have different colors). Let's try to find and , the expected number of clusters in a chunk expected to be added after a column with an column and column, respectively.
Let's say our chunk starts with an column. The next column could be a nonmatching column ( chance), a matching column ( chance), or a column ( chance). If it is nonmatching, the chunk ends, and the value is 0. If it is matching, no new clusters are added, so the value is . If it is a column, one cluster is added (whichever color is unmatching), making the value . All together, we get that .
Now let's say that our chunk starts with a column. The next column could be nonmatching column ( chance), a matching column ( chance), or an column ( chance). Like before, a nonmatching column ends the chunk, making the value 0. A matching column adds no new clusters, so the value is . If it is an column, no new cluster is added, so the value is . All together, we have .
With substitution, we get that , and .
How does this translate to chunks overall? To find the expected number of regions per chunk, , we consider as the first column, which yields clusters, and as the first column, which yields clusters (as necessitates the start of two differently colored clusters). Each has an equal chance, so .
This means we expect 2.5 clusters per chunk.
So how many squares per cluster?
With 8 squares per chunk and 2.5 clusters per chunk, we can expect squares per cluster!
To verify my answer, I made a simulation:
Code
import random


random.seed(12)

T = 10**7
all_regions: list[int] = []
a, b = random.randrange(2), random.randrange(2)
regions = [2 - a - b, a + b]
for t in range(T):
    c, d = random.randrange(2), random.randrange(2)
    if c == d:
        regions[c] += 2
        all_regions.append(regions[1 - c])
        regions[1 - c] = 0
    else:
        if a == b or a == c:
            regions[c] += 1
            regions[d] += 1
        else:
            all_regions.extend(regions)
            regions[c] = 1
            regions[d] = 1
    a, b = c, d
all_regions.extend(regions)
whole_regions = [region for region in all_regions if region]
print(sum(whole_regions) / len(whole_regions))
Output: 3.2002681184361506
Seems about right!
Answer: 3.2 squares
Beyond
If I had more time, I'd love to explore what implications this has for strips with more than 2 rows... or more than 2 colors! Sitting tight for the person/people who end up doing that :)
— Emily